
February 2026 US Labor Force Data: No Trump Effect to Date
Here I focus on participation rates, not unemployment

Introduction
This morning the Bureau of Labor Statistics released data for February 2026. It’s important to get beyond the headlines, so here I look at select details that typically aren’t covered by the media.
Participation rates show little change in the labor market over the past 12 months.
I’ve been tracking the monthly Bureau of Labor Statistics data release for 30 years, as I presented current data in the introductory “Principles of Economics” courses that I taught every term. Here I focus on data series that are less widely reported, participation rates (the share of people in the labor force, working or seeking work) by age and gender. 1
Participation
Age-specific participation data are noisy: sample sizes shrink as you go from overall participation (those in the labor force as a share of the working age population) to the participation rate for (say) women age 65-69. In addition, for teens (and for older workers) rates vary on a seasonal basis, with summer jobs and retail and delivery jobs during from Thanksgiving into the new year. Furthermore, there are secular trends: over the past decades fewer teens hold jobs, and more elderly are working. First, though, I’ll look at recent changes. Then I’ll present long-run trends.
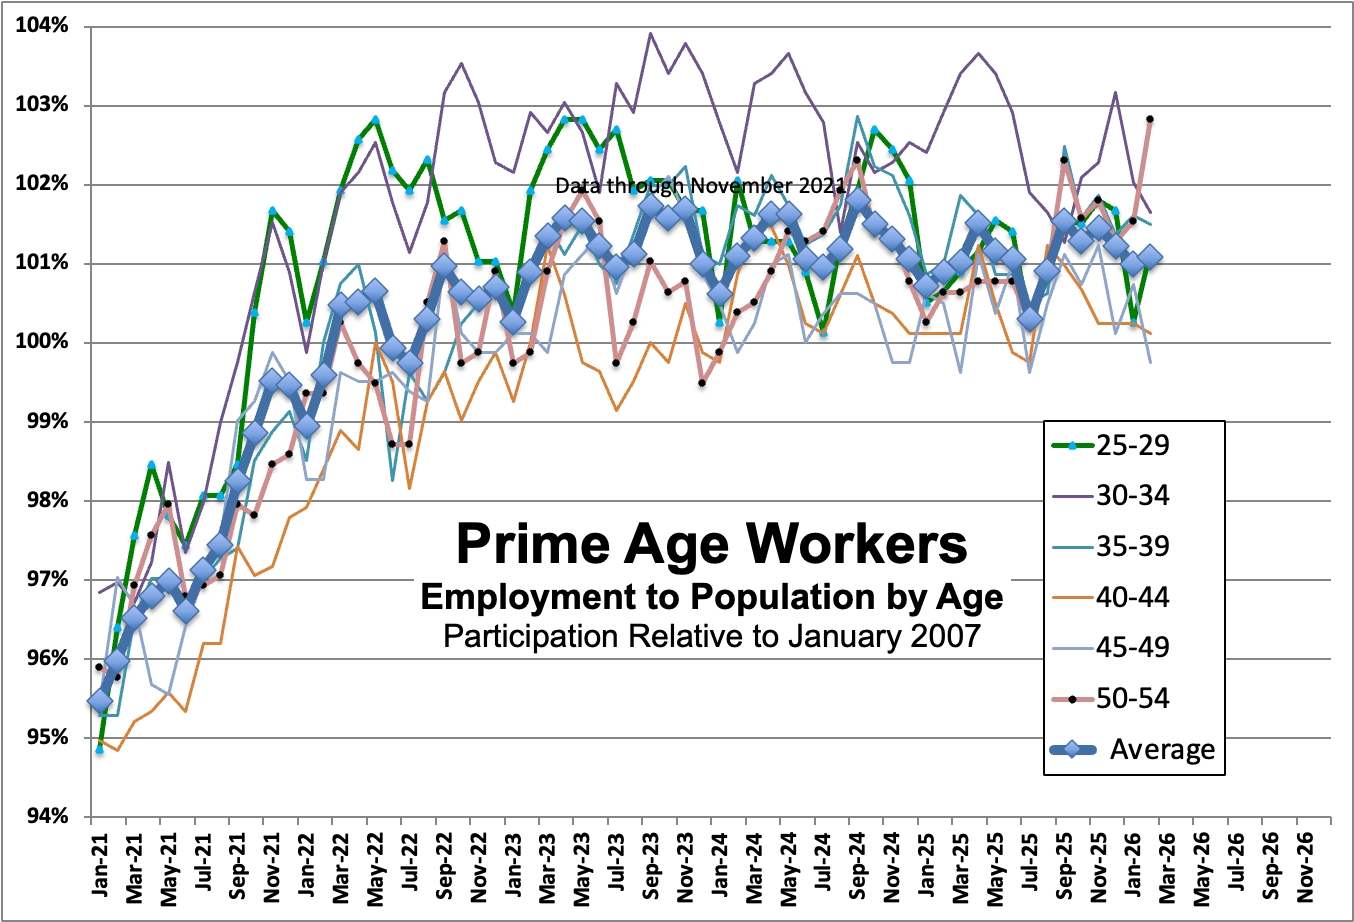
January 2021 to February 2026
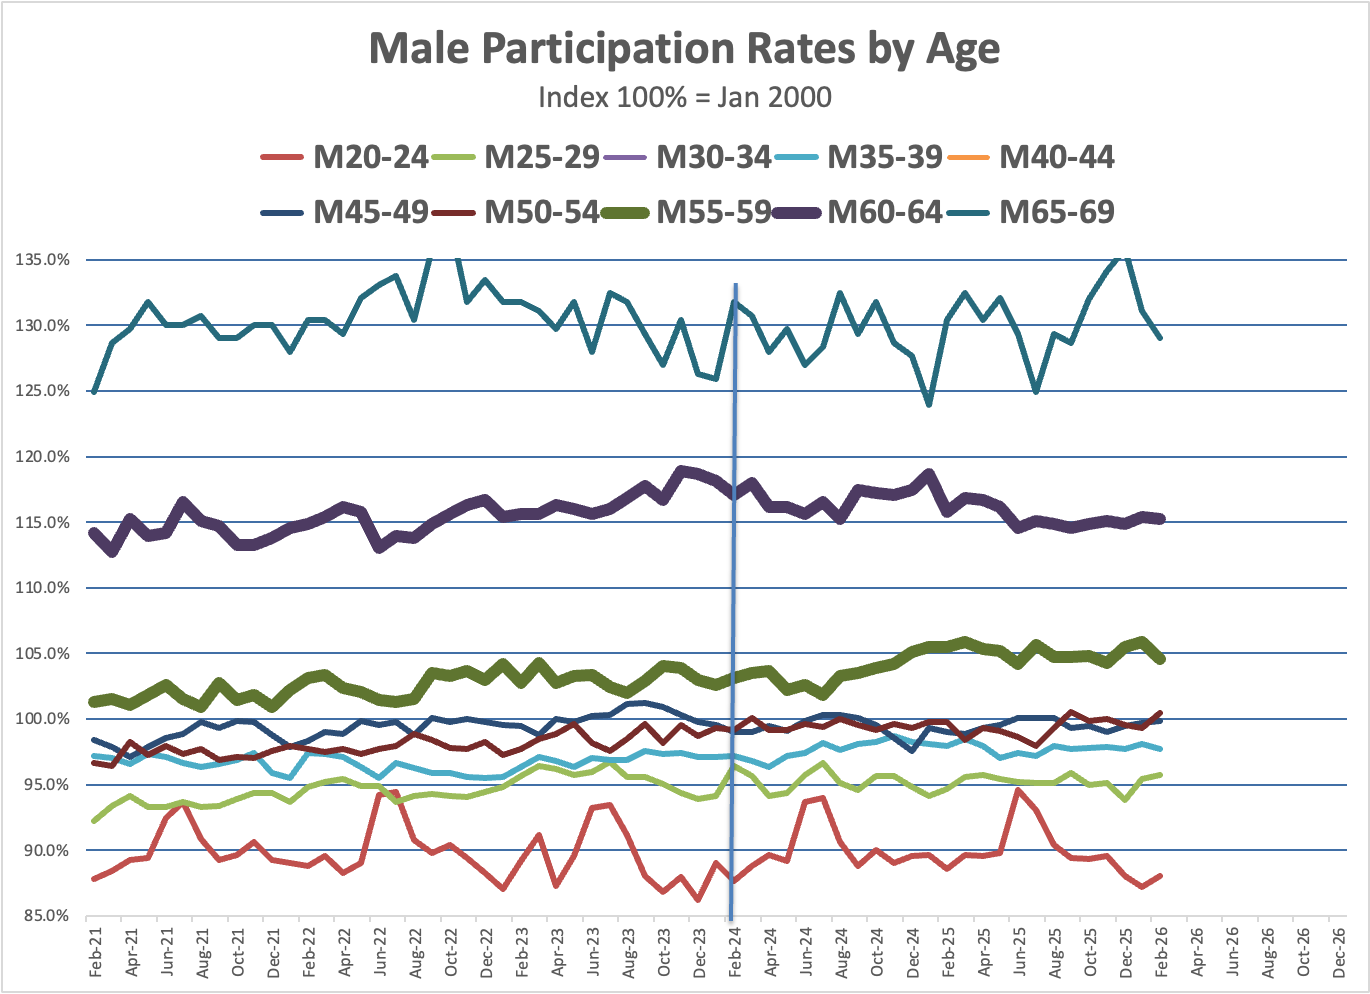
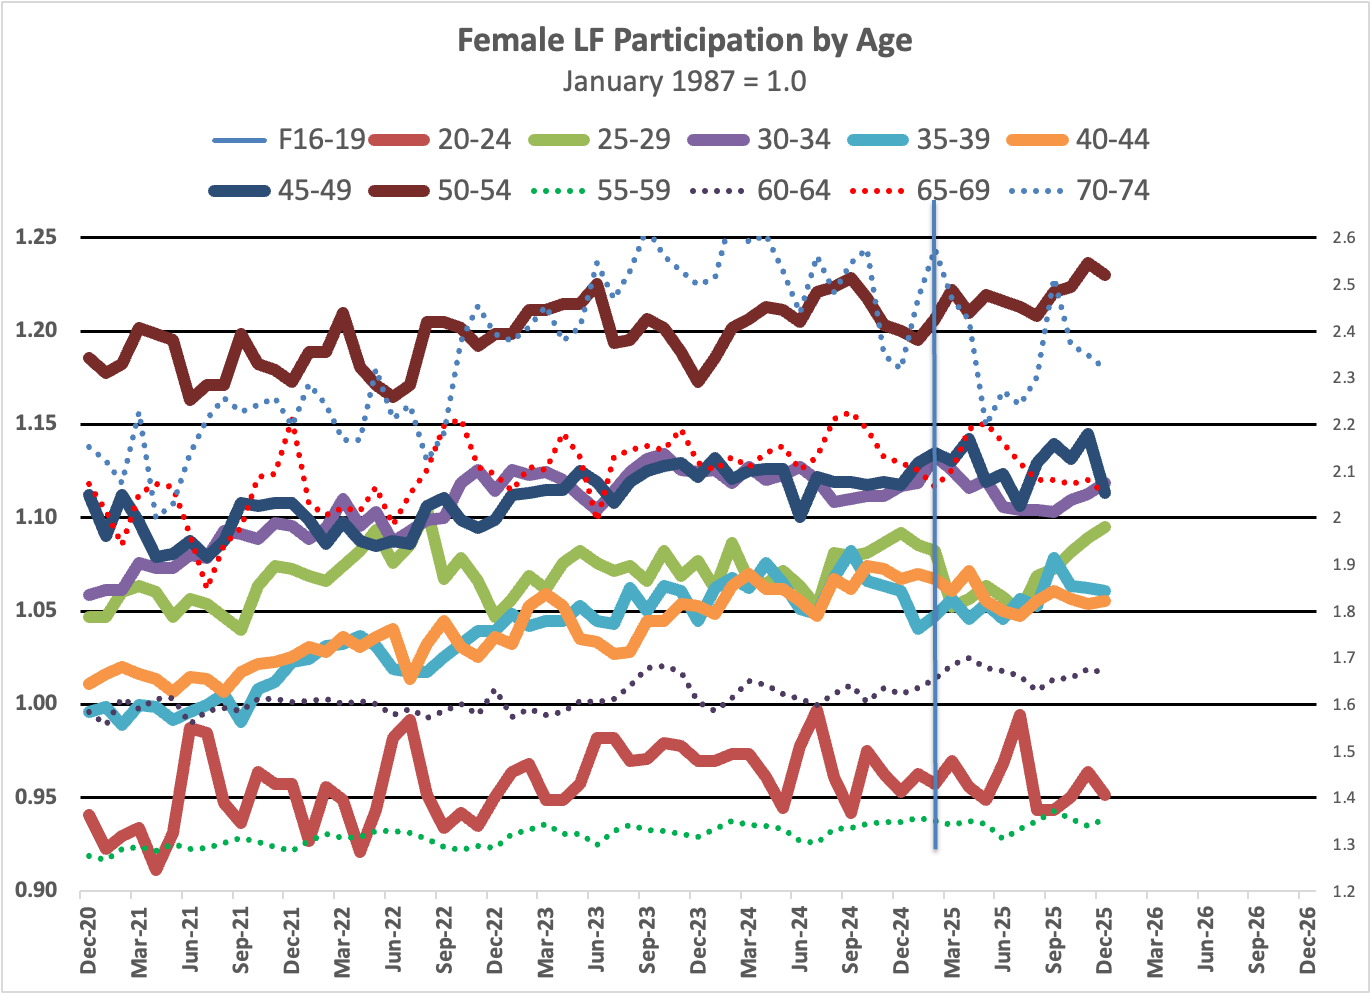
Has there been any change since the current Administration came into office? Basically, no. For the labor force as a whole, there’s little change in prime age participation. For men, there’s a slight rise age 55-59 and a slight fall age 60-64, but basically there’s no change relative to February 2025, or for that matter relative to January 2021. For women, there’s a slight rise age 50-54, but we can also see modest secular increases age 30 and above.
Longer term changes:
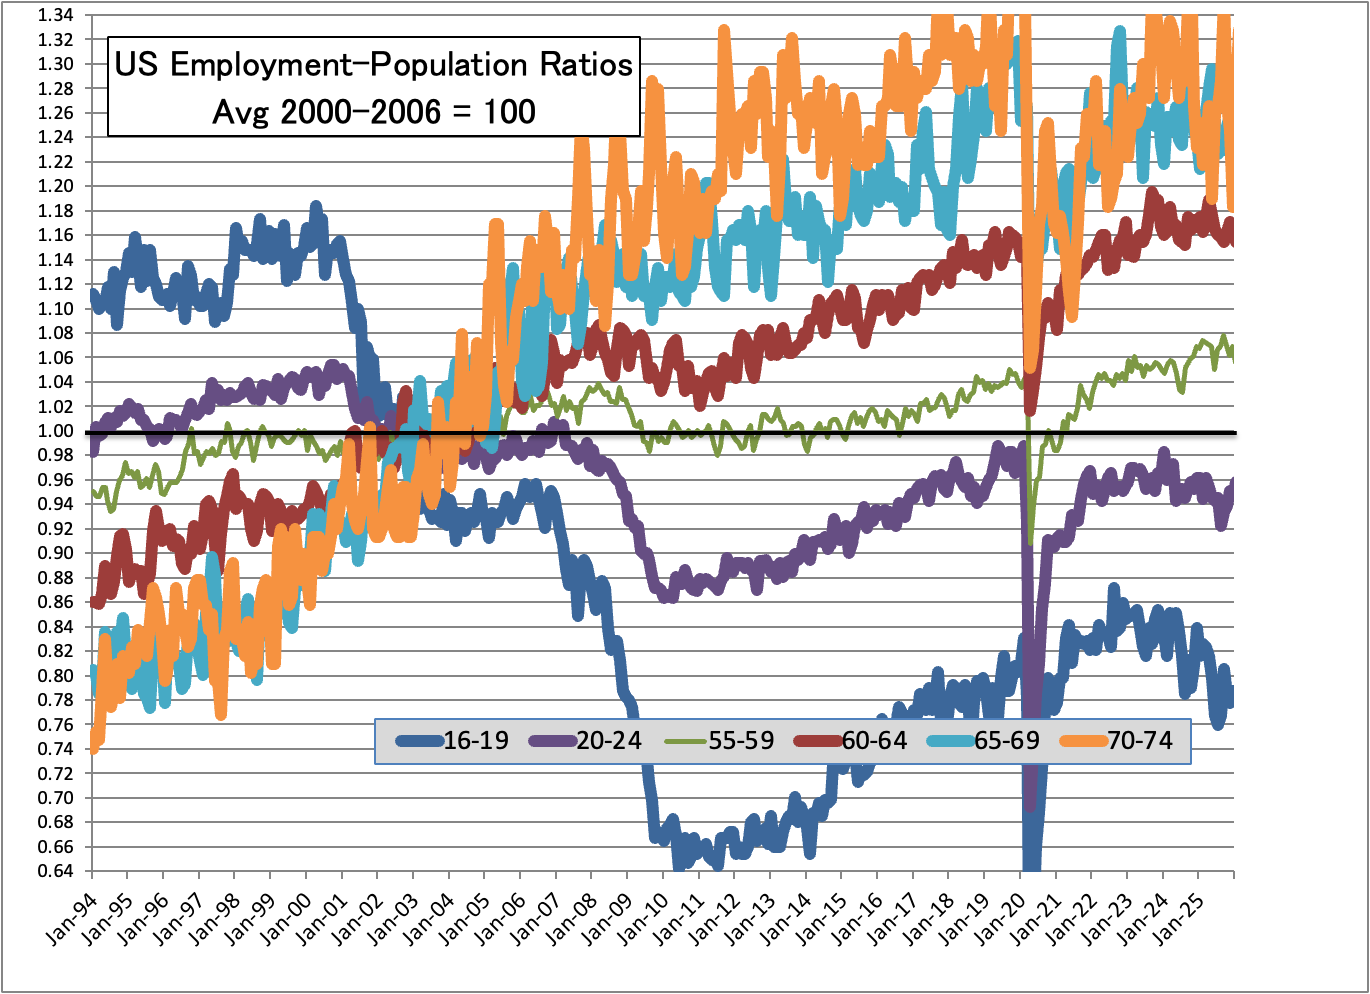
The current reporting categories are available by gender only from 1987, when brackets were added for ages 70-74 and 75+. Otherwise data go back to 1976 for most age brackets, but to 1948 for ages 16-19 and 20-24. Overall data however go back only to 1994. Even within that short period of 3 decades, we see dramatic changes at the young and old ends of the labor market, in my chart expressed as an index relative to the period leading up to the Great Recession. In contrast, for prime workers – here I only include age 55-59 – there’s little change.
There are big changes for teens and older Americans.
Now using an index hides that in absolute terms, relatively few Americans above age 65 are in the labor force. In January 1994 just under 11% of those age 70-74 were in the labor force; it’s now 19%, so the share has climbed 80% over three decades. For age 65-69, the rate has gove from 20-21% to 32%, a 50% increase. (Given volatility, max to min is greater…)
The opposite is the case for younger workers. In 1994, some 43% of teens (well, those age 16-19) were in the labor force. Now those data are available over a longer time span; in the late 1940s, the rate was 48%. More recently it’s 30%. For those of college age, the rate rose from 60% in 1948 to 72% in the late 1980s, before dropping 66%.
Gender
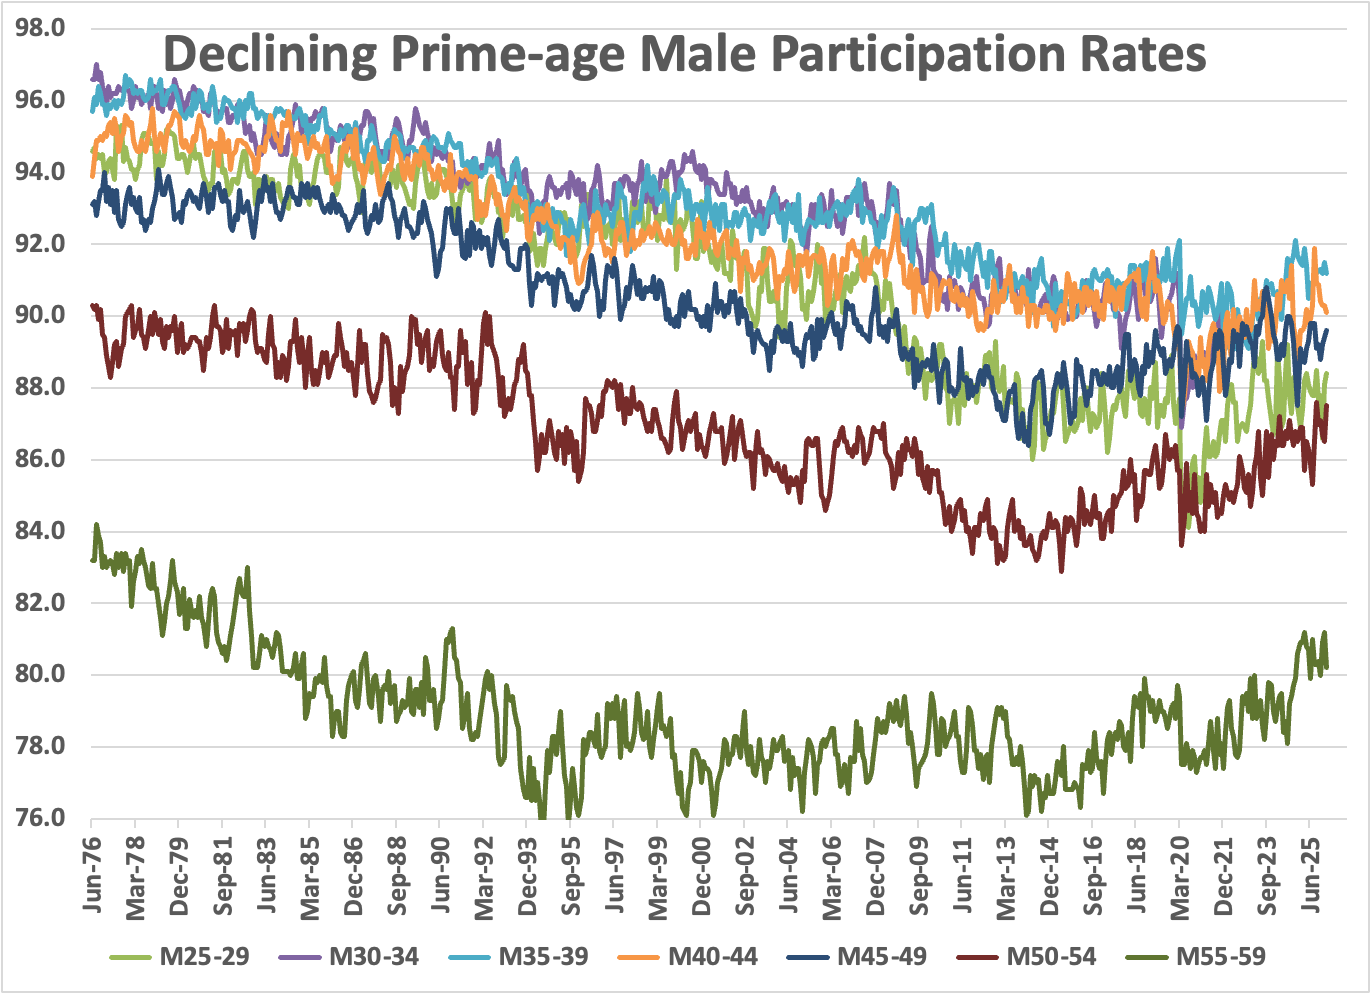
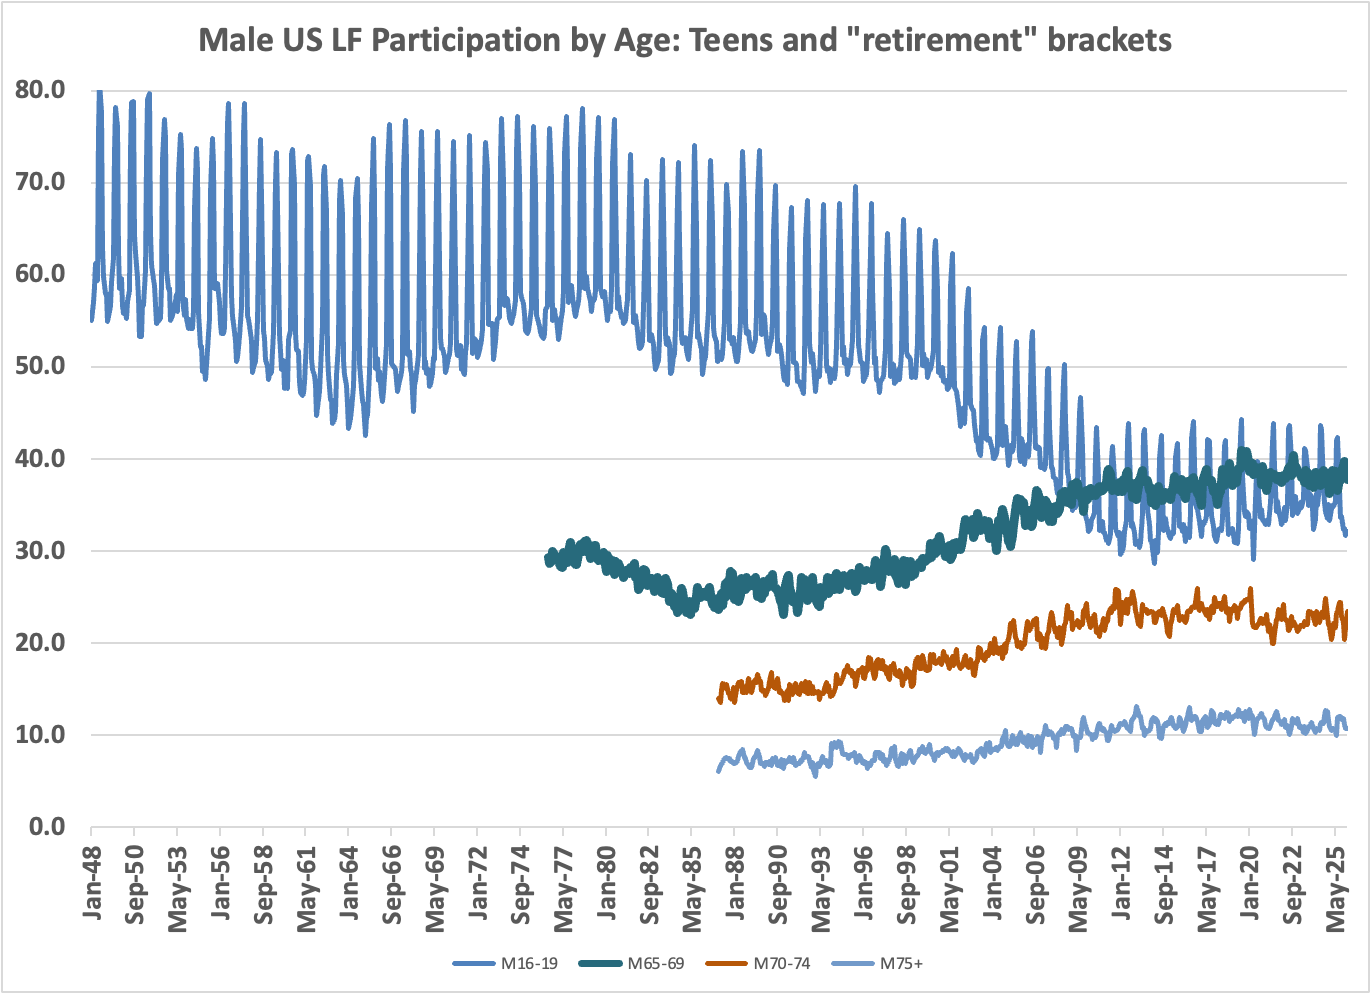
This hides divergent behavior by gender. Participation by prime-age men fell decade after decade, until rising the past 5 years for those age 45-59. I give a separate chart above for teens and those often thought as retirement age. You can see the seasonal volatility of teen participation, as well as the large decline, mostly after 1990. More kids completing high school? Jobs squeezed out by after-school activities? I don’t know.
Over the past 50 years fewer men work, and more women.
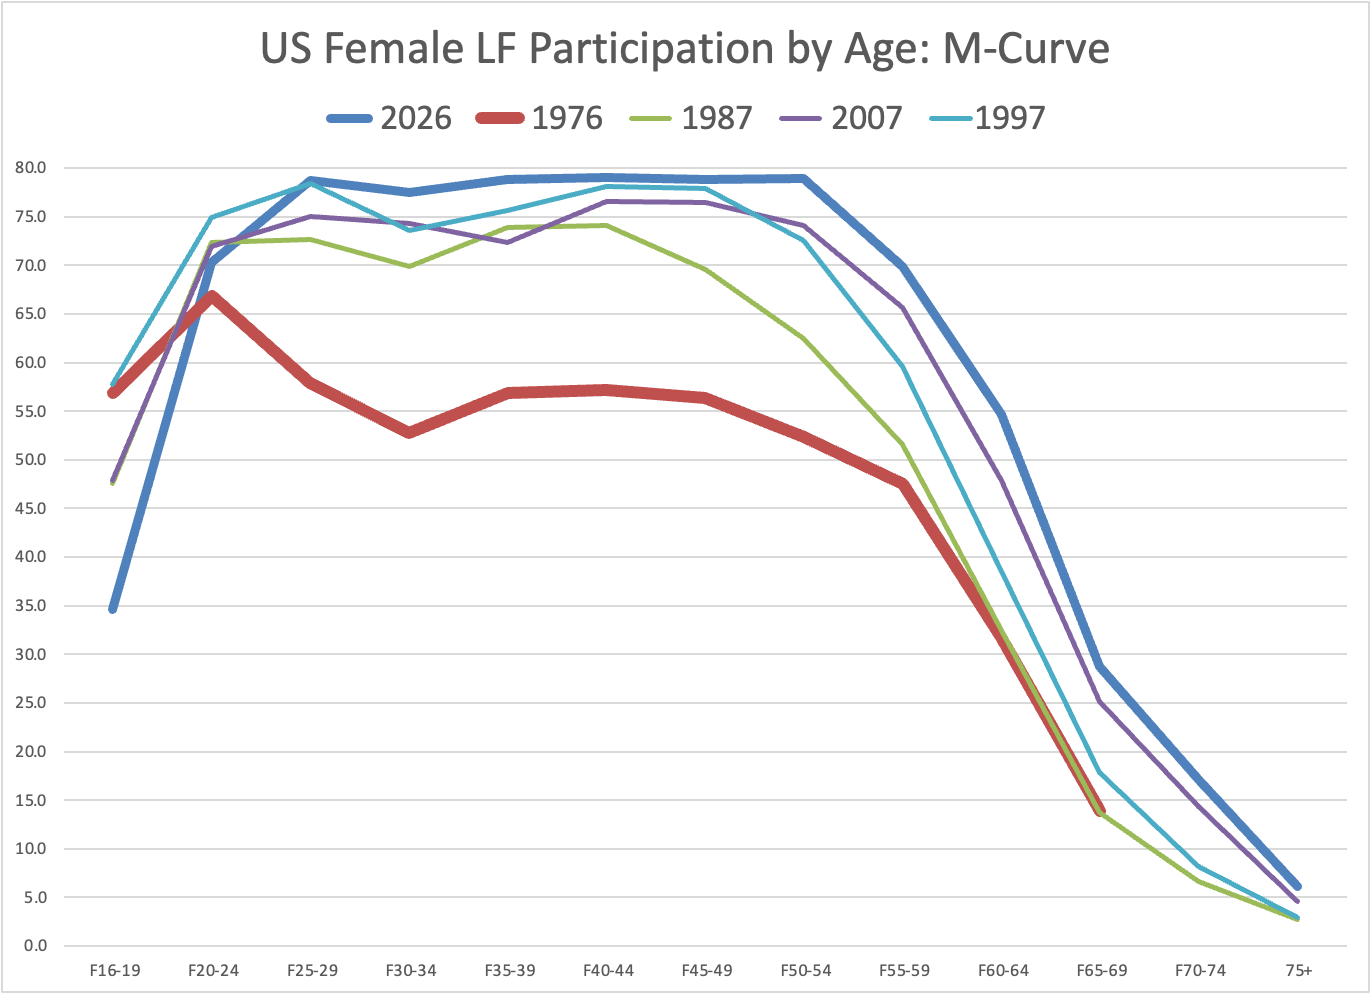
In contrast, more women work at all ages. Here I use the “M-curve” format, named because women tended to drop out of the labor force after marriage, and (in the US but not Japan) only some re-entered in their 30s. Over time the “M” vanished, but the decline in teen participation, and for women 20-24 (of college age) is readily apparent. In addition, except at the two youngest age brackets, more women work today than at any time in the past.
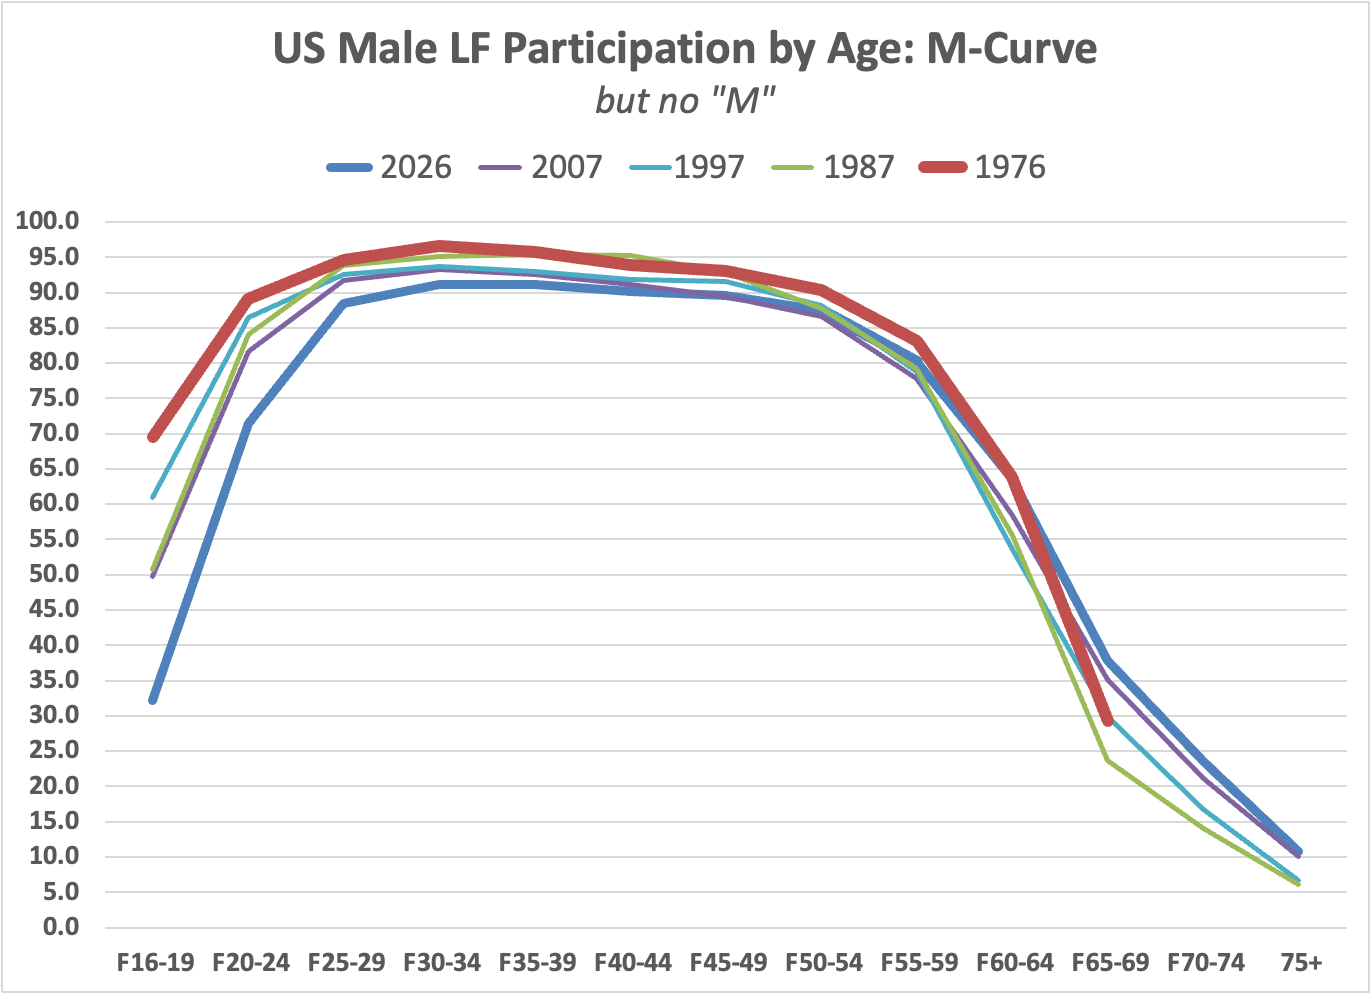
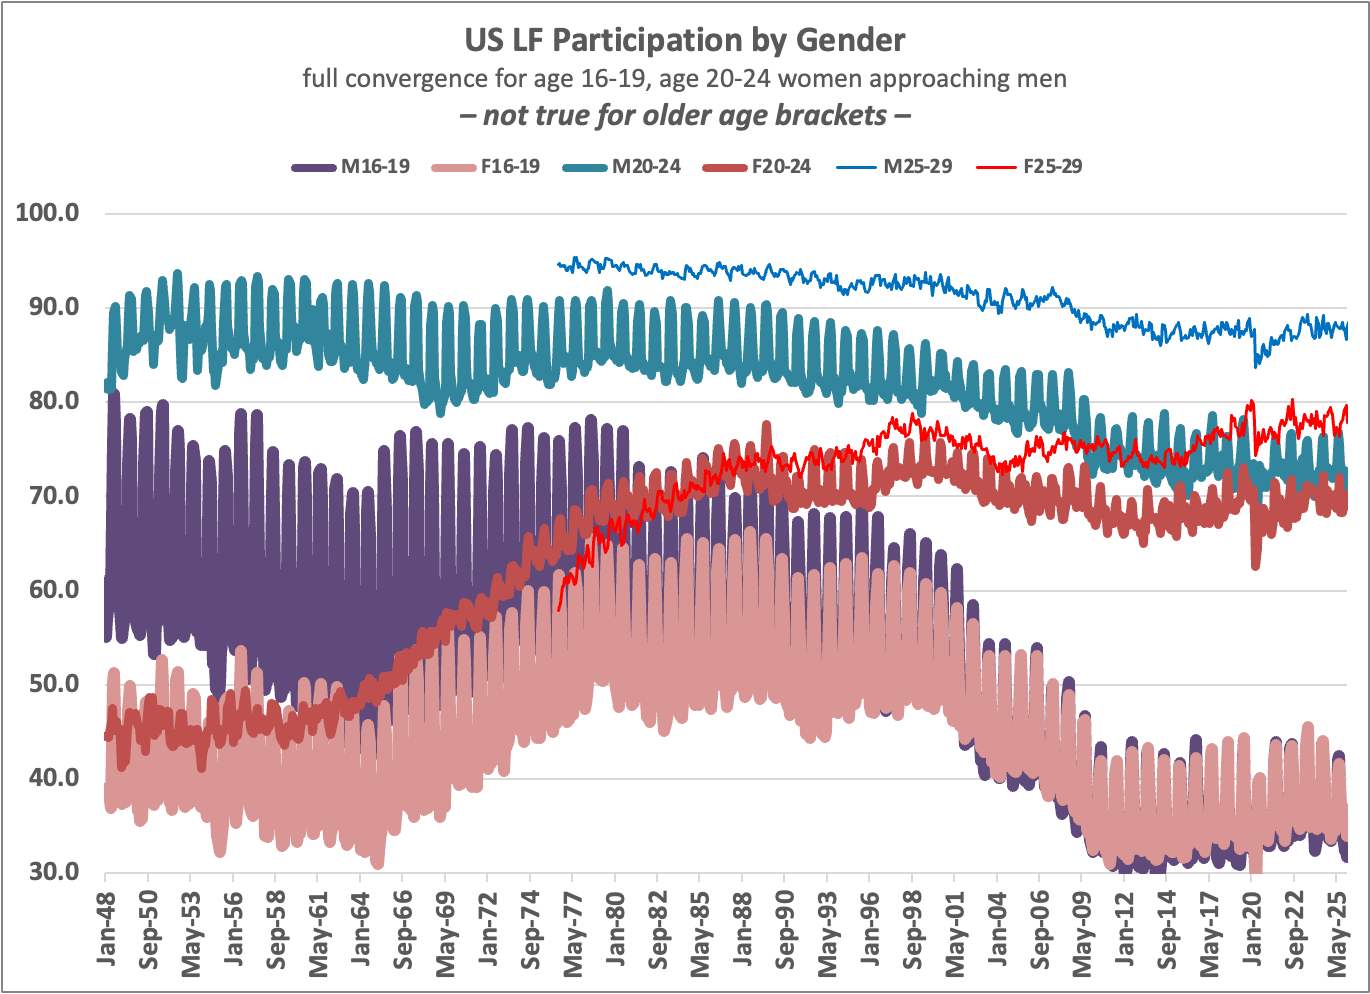
For consistency/comparability, I created the same chart for men. No “M” at any point, but instead of 2026 lying above the other curves, until age 55-59 it instead lies below.
Finally, there’s full convergence by gender in the (now lower) level of teen LF participation. (If anything, slightly more teen women are in the labor force.) The rates for men and for women age 20-24 were very different in 1976 – the rate for women was 40 percentage points lower – but they are now almost the same. While the gap is smaller age 25-29, for women it’s still nearly 10 percentage points lower. One last check: for older workers there’s still a gap with more men in the labor force, but for the oldest 3 brackets there’s no time trend over the past 40 years, while for 60-64 year olds the gap shrank from 30 percentage points to 10 percentage points, with little change over the past 20 years. Women live longer than men, so I had expected that by age 70 there would be little gap. That’s not the case, though I have no idea why.
Conclusion
Looking at participation rates, there’s little change over the past 12 months. The same is true of many other measures, such as the unemployment rate, which I also track. At the aggregate level there is no obvious Trump effect – remember, monthly data are volatile. Major outlets have to report the latest numbers, and need a headline. Ones that shout get more clicks, and with volatility there are always “surprises.” I want to see trends, and there aren’t big ones, yet.
There is one exception: manufacturing continues to shrink, as does the narrower category of automotive manufacturing, which is down about 30,000 jobs. But I’ve already written about that, and the latest month is only another increment in the same direction.
For data nerds, each series has a code, and I maintain that list in my spreadsheet. I simply copy and past that list into the “Series Report” field under “Data Tools,” create a “Multiseries Table” which I download as a spreadsheet. I then transpose and paste the new data into my participation rate spreadsheet (as I have the data in columns). It takes a couple minutes. Then there’s the tedium of tweaking graphs. Though I have them set up through the end of the year, well, it’s a new year.